When preparing for IEO Business Case Presentations, many students focus on slide aesthetics or financial accuracy. However, the core challenge in the International Economics Olympiad (IEO) business case round is not just calculating profit, but identifying which assumption drives your entire strategy and proving why it holds under scrutiny. A technically correct model built on an unexamined premise fails harder than a simple model with defended logic.
The Anatomy of a Winning Argument
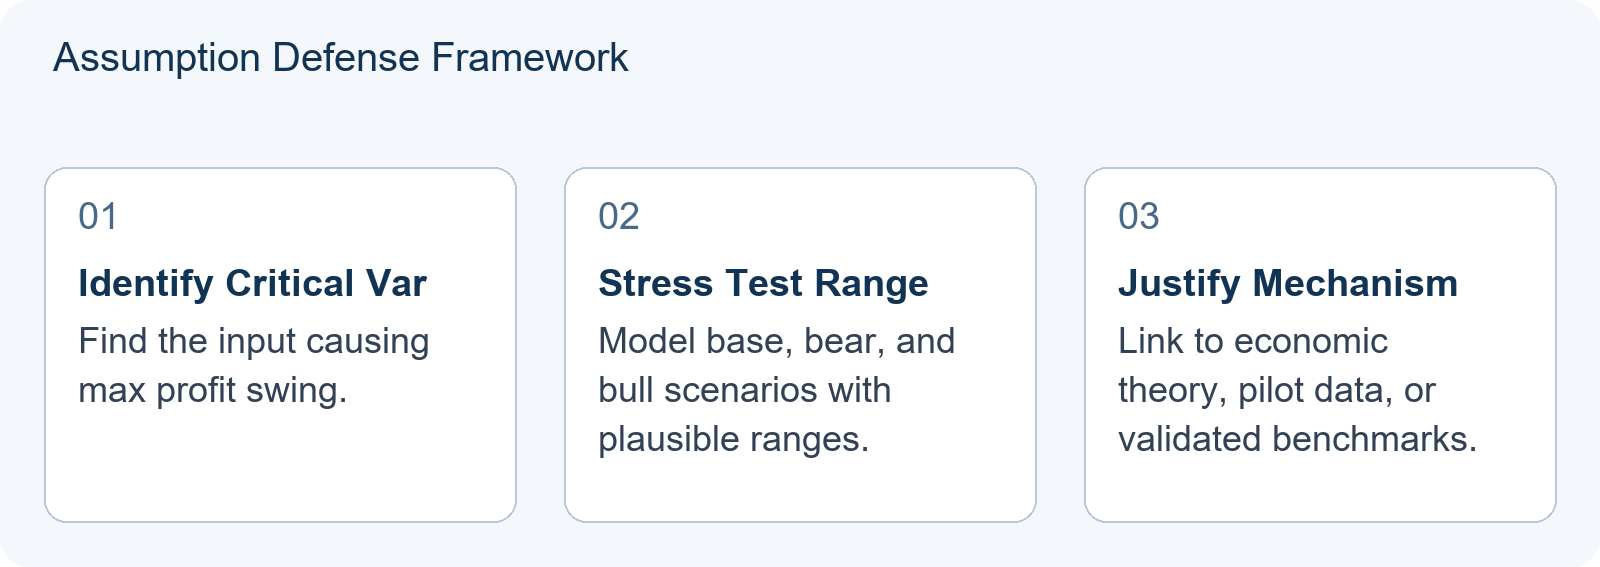
A strong IEO business case presentation follows a specific logical structure: Identify the Core Assumption, Stress-Test It, and Justify It with Evidence. This approach transforms a static financial projection into a dynamic strategic argument. Judges look for candidates who understand that every business model rests on fragile premises—whether about consumer behavior, market size, or cost structures—and who can articulate why their chosen premise is the most defensible one available.
Step 1: Identifying the Critical Assumption
In any business case, multiple assumptions exist. For example, a subscription service might assume high retention rates, low churn, and scalable customer acquisition costs. The “critical” assumption is the one where a small change causes the largest swing in profitability or viability. If you assume a 5% monthly churn rate, but the actual rate is 10%, does your business still work? If no, then churn is your critical assumption. Many teams miss this by focusing on revenue growth instead of unit economics. Our preparation materials emphasize mapping sensitivity early; see our guide on IEO Business Case Unit Economics: Testing Whether Growth Improves the Business for more on this distinction.
Step 2: Stress-Testing the Premise
Once identified, you must test the assumption against realistic scenarios. This involves creating a “base case,” a “bear case,” and a “bull case.” The bear case should represent a plausible failure mode, not a catastrophic outlier. For instance, if your critical assumption is that customers will pay $10/month, the bear case might be $7/month due to competitor pricing. You then recalculate key metrics like Customer Acquisition Cost (CAC) payback period and Lifetime Value (LTV). This quantitative rigor demonstrates that you understand the mechanics of the business, not just the narrative. We cover similar analytical frameworks in our article on The Business Toolkit for the IEO Case Round: Unit Economics, Break-Even and Sizing a Market.
Step 3: Justifying with Qualitative Evidence
Numbers alone do not defend an assumption; context does. You must provide qualitative reasons why your base case is likely. This could include industry benchmarks, psychological principles from behavioral economics, or historical data from similar markets. For example, if you assume high retention, cite network effects or switching costs as the mechanism driving that retention. This links your financial model back to economic theory, a hallmark of high-scoring IEO entries. Students often struggle to connect these dots; our resource on What the IEO Business Case Has Actually Asked: Three Prompts, One Recurring Shape provides examples of how past prompts required this theoretical grounding.
Teaching Illustration: The Coffee Subscription Model
Note: This is a hypothetical teaching example created for illustration purposes. It is not an official IEO contest problem, official scoring guidance, or verified industry data.
Imagine a team proposing a weekly coffee bean subscription service targeting young professionals. Their initial model assumes:
- Price per box: $20
- Cost of Goods Sold (COGS): $10
- Monthly Churn: 5%
- Customer Acquisition Cost (CAC): $40
At first glance, the margins look healthy ($10 gross profit per box). The critical assumption here is the 5% monthly churn rate. Let us stress-test this with a simplified constant monthly margin and geometric churn model, ignoring discounting, fixed costs, and payment timing.
Base case (5% churn): Average customer lifetime = 1/0.05 = 20 months. LTV = $10 × 20 = $200. LTV/CAC = 200/40 = 5.0.
Bear case (10% churn): Lifetime = 1/0.10 = 10 months. LTV = $10 × 10 = $100. LTV/CAC = 100/40 = 2.5.
Severe case (15% churn): Lifetime = 1/0.15 ≈ 6.67 months. LTV = $10 × 6.67 = $66.70. LTV/CAC = 66.70/40 ≈ 1.67. The business still recovers CAC, but with thin margin.
Breakeven threshold (25% churn): Lifetime = 1/0.25 = 4 months. LTV = $10 × 4 = $40 = CAC. LTV/CAC = 1.0. This is the breakeven point in this simplified model.
Failure case (30% churn): Lifetime = 1/0.30 ≈ 3.33 months. LTV = $10 × 3.33 ≈ $33.33. LTV/CAC ≈ 0.83. Now LTV falls below CAC; the business fails to recover acquisition costs.
Important caveat: Because this model ignores discounting, fixed costs, and payment timing, an LTV/CAC ratio above 1 does not guarantee business viability. It merely indicates that direct customer economics are positive in this simplified framework.
Defending the Assumption
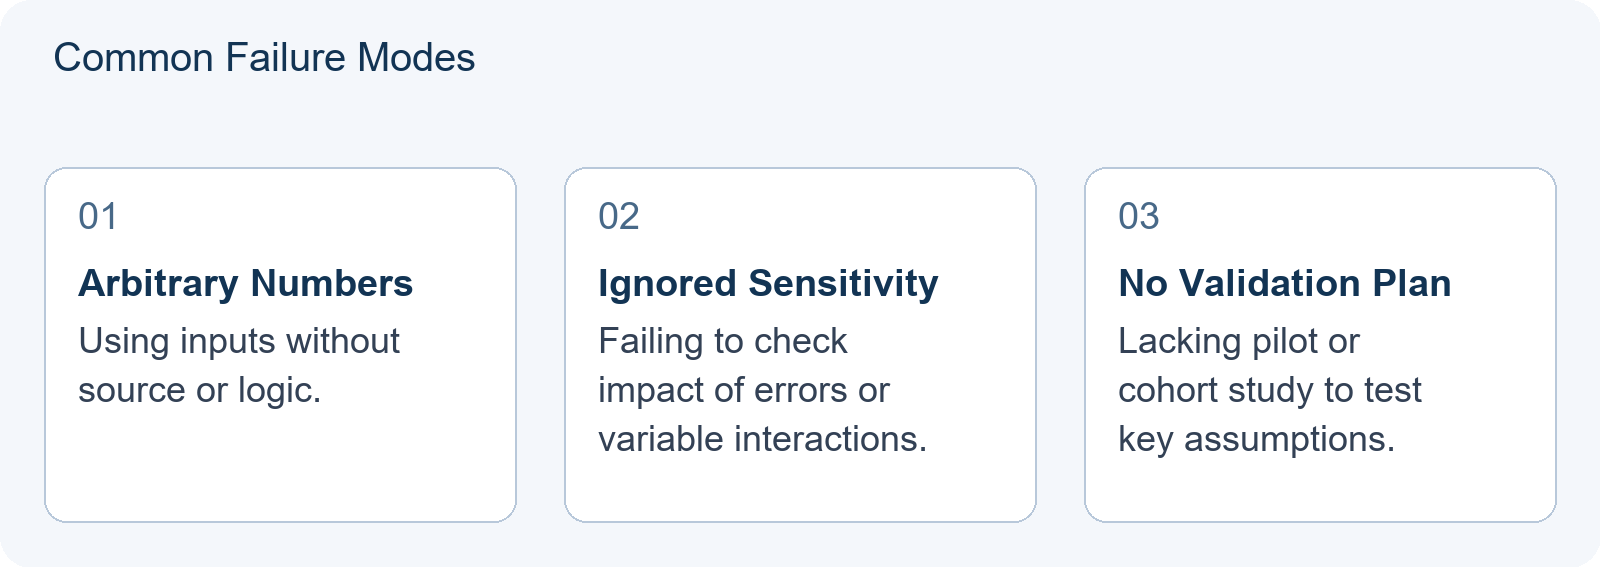
To win points, the team must defend why they believe 5% churn is achievable. A weak defense says, “We think people love coffee.” A strong defense argues: “Our model includes a ‘pause’ feature and loyalty discounts after three boxes, which reduces perceived commitment anxiety. However, we acknowledge this is unproven. We propose a three-month pilot with cohort tracking to validate whether these features achieve the target churn rate before scaling acquisition spend.” This demonstrates intellectual honesty and a plan to validate assumptions with data rather than asserting them.
Contrasting Teaching Illustration: The Failed Defense
Note: This second hypothetical teaching example shows common errors in business case presentations.
Consider a contrasting team with the same numbers but a different approach. They present a beautiful slide deck showing exponential growth curves. When asked about churn, they admit they assumed 5% because “it looked good in the spreadsheet.” They offer no mechanism for retention, no sensitivity analysis, and no plan to test whether the assumption holds. In this scenario, even if their math is perfect, the presentation fails because the foundation is arbitrary. Judges cannot trust a model where the most volatile variable is ignored. This highlights why defending the assumption is more valuable than raw calculation speed.
Practical Application: The Diagnostic Exercise
To prepare for IEO Business Case Presentations, try this diagnostic exercise with your current practice cases:
- Isolate Variables: List all major assumptions in your model (price, volume, cost, churn, conversion rate).
- Sensitivity Check: Change each variable by plausible ranges based on market research, not arbitrary percentages. Identify which variable changes your net profit most dramatically. That is your critical assumption.
- Mechanism Search: Find one economic principle or real-world fact that supports your base case for that variable. If you cannot find one, your assumption is weak.
- Interaction Check: Consider whether variables move together. For example, does lower price increase churn? Does higher marketing spend attract less loyal customers? Single-variable sensitivity may understate true risk.
- Pivot Strategy: Draft a one-sentence response to the question: “What happens if this assumption is wrong?” Your answer should show a pre-planned mitigation strategy, not panic.
This process ensures you are ready for the Q&A portion of the presentation, where judges probe the weakest links. Remember, the goal is not to prove you are right, but to prove you have thought deeply enough to handle being wrong.
Conclusion: From Calculation to Consultation
Success in IEO Business Case Presentations requires shifting from a calculator mindset to a consultant mindset. Calculators produce answers; consultants produce arguments. By identifying, testing, and defending your critical assumptions, you demonstrate the analytical maturity that distinguishes medalists from participants. Use this framework to review your past mock cases and refine your upcoming preparations.
Interpreting the Sensitivity Curve: From Numbers to Narrative
The teaching illustration above demonstrates that churn is a binary switch for viability in this simplified model. However, judges do not just want to see that you know the break-even point at 25% churn; they want to see how you interpret the risk profile between 5% and 25%. A common error is treating all deviations equally. In reality, the distance from your base case (5%) to the failure threshold (25%) represents your “margin of safety.” If your base case assumes 5% churn, but industry benchmarks for similar subscription services suggest 8-10%, your margin of safety is thin. You are operating close to the bear case, not the bull case.
Diagnostic Exercise: The Margin of Safety Check
To practice this interpretation, use the following diagnostic on your own mock cases. This exercise forces you to quantify the gap between assumption and reality without inventing new data.
Scenario: Your team proposes a digital tutoring platform. Base case assumptions: Monthly price $50, COGS $20, Churn 4%, CAC $60.
Step 1: Calculate Base Case LTV/CAC.
Lifetime = 1/0.04 = 25 months.
LTV = ($50 – $20) × 25 = $750.
LTV/CAC = 750 / 60 = 12.5.
Step 2: Identify the Break-Even Churn Rate.
Break-even occurs when LTV = CAC.
$30 × (1/churn) = $60.
1/churn = 2.
Churn = 50%.
Step 3: Interpret the Gap.
Your base case (4%) is far below the break-even point (50%). This suggests high resilience to churn errors. However, does this mean you can ignore churn? No. It means churn is not your critical assumption. If you spend your presentation time defending why 4% is realistic, you are wasting effort on a non-binding constraint. Instead, look for another variable. What if CAC rises to $300? Then LTV/CAC = 2.5. What if price drops to $30? Gross profit becomes $10. Lifetime remains 25 months. LTV = $250. LTV/CAC = 250/60 ≈ 4.17. Still viable. But if both happen? Price $30, CAC $300. LTV = $250. LTV/CAC < 1. Failure.
Explicit Answer: In this diagnostic, the critical assumption is not churn, but the combination of pricing power and acquisition efficiency. The correct defense strategy shifts from retention mechanics to market positioning and channel optimization. By calculating the break-even threshold first, you identify which variables actually threaten viability, allowing you to focus your qualitative evidence on those specific levers.
Next Practice Task: The Pivot Draft
Take one of your previous mock business cases. Perform the three steps above: calculate base LTV/CAC, find the break-even threshold for your most volatile variable, and assess the margin of safety. If the margin is wide, discard that variable as your primary defense focus. Find the variable with the narrowest margin or highest sensitivity interaction. Write a single paragraph explaining why this new variable is the true critical assumption, citing a plausible range rather than an arbitrary percentage. This trains you to let the math dictate the narrative, not the other way around.
Frequently Asked Questions
How much time should I spend on sensitivity analysis?
Allocate substantial preparation time to identifying and testing critical assumptions. Judges prioritize logical robustness over complex calculations. The exact percentage varies by case complexity, but thorough sensitivity work with plausible ranges and interaction effects is essential.
What if my assumption is obviously uncertain?
Acknowledge the limitation explicitly. Explain why it is the best available proxy given data constraints, and show how your conclusion holds under alternative scenarios. Propose a pilot or cohort tracking study to validate the assumption if possible.
Do I need advanced statistical tools?
No. Simple unit economics and clear qualitative reasoning are sufficient. Over-complicating the model often obscures the core economic logic. Focus on defending assumptions rather than demonstrating technical sophistication.