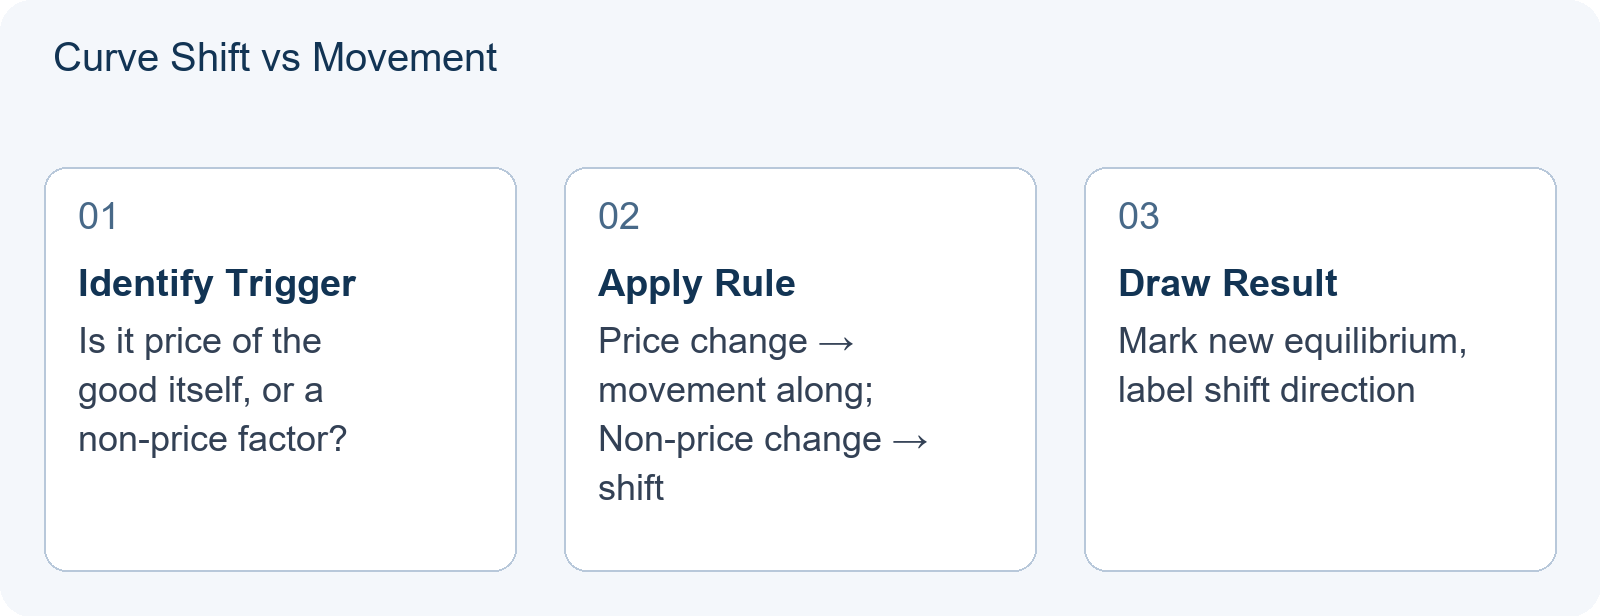
The Core Distinction in IEO Economics Graphs
For students preparing for the International Economics Olympiad (IEO), one of the most persistent reasoning errors involves misinterpreting supply and demand diagrams. The confusion lies between a shift of the entire curve and a movement along an existing curve. While this seems fundamental, competition questions often embed subtle triggers that test whether you can correctly identify which mechanism is at play. This article focuses exclusively on that specific skill, assuming you already understand basic market structures.
Teaching Illustration 1: The Input Cost Trigger (Correct Analysis)
[Teaching illustration — not an official past paper question]
Consider a scenario where a frost in Brazil raises the price of coffee beans. In the market for brewed coffee, beans are a key input. The higher input cost causes the supply curve for brewed coffee to shift left. The new equilibrium features a higher price and lower quantity of brewed coffee traded.
Now observe what happens to quantity: consumers buy less coffee because the price rose. This reduction is a movement along the demand curve — not a shift of it. The demand curve itself stays put; consumer preferences, incomes, and prices of substitutes are unchanged. The price change was an outcome of the supply shift, not a cause of demand changing. The trigger here was the input cost increase, which shifted supply; the resulting equilibrium price increase then caused the movement along demand.
Teaching Illustration 2: The Common Mistake — Confusing Cause and Effect
[Teaching illustration — not an official past paper question]
A student sees that coffee prices have risen and concludes: “Coffee is more expensive, so demand must have fallen, shifting the demand curve left.” This reverses cause and effect. The price rise was the result of a supply contraction (Illustration 1), not evidence of weakened demand. If demand had truly shifted left, the price would have fallen, not risen. The student mistakenly treats the higher price as a trigger for demand shift, when in fact the price change was the outcome of the supply shift. This error is particularly common when students observe market data without tracing the underlying causal chain.
Teaching Illustration 3: The Preference Trigger (Corrected Analysis)
[Teaching illustration — not an official past paper question]
Contrast this with a health study revealing that moderate coffee consumption reduces heart disease risk. Here, consumer preferences change directly. The demand curve for coffee shifts right. At the new equilibrium, price rises. Suppliers respond to this higher price by increasing quantity supplied — a movement along the supply curve. The supply curve itself does not shift because production technology and input costs remain constant. The trigger was the preference change, which shifted demand; the resulting equilibrium price increase then caused the movement along supply.
Diagnostic Table: Identifying the Mechanism
| Trigger Type | Effect on Curve | Resulting Change |
|---|---|---|
| Change in Price of Good Itself | No Shift | Movement Along |
| Change in Income / Preferences / Prices of Related Goods | Demand Shifts | New Equilibrium |
| Change in Input Costs / Technology / Number of Sellers | Supply Shifts | New Equilibrium |
Targeted Practice Sequence
To master this distinction, structure your practice in three steps. First, review foundational concepts via our IEO Preparation for STEM Students: Starting Without School Economics to establish core vocabulary. Next, attempt to diagram three scenarios: one involving a tax on producers, one involving a change in consumer tastes, and one involving a technological breakthrough in production. For each, explicitly label whether the primary effect is a shift or a movement, and state which curve moves and why. Finally, consult our The Business Toolkit for the IEO Case Round: Unit Economics, Break-Even and Sizing a Market to see how graphical reasoning connects to quantitative case analysis. For broader context on entering without traditional economics coursework, see No Economics Course at Your School? The IEO Route In from a Maths or Science Track.
Next Steps for Learners
A learner should be able to verbally explain why a rise in the price of tea (a substitute) causes the coffee demand curve to shift, while a rise in the price of coffee itself causes movement along the coffee demand curve. This verbal precision is often tested in oral rounds or written explanations. Ensure your practice includes writing out these causal chains clearly, not just drawing arrows. The skill demonstrated here — separating curve shifts from movements along curves — is foundational for more advanced IEO topics including tax incidence, subsidy analysis, and international trade diagrams where multiple curve interactions appear.
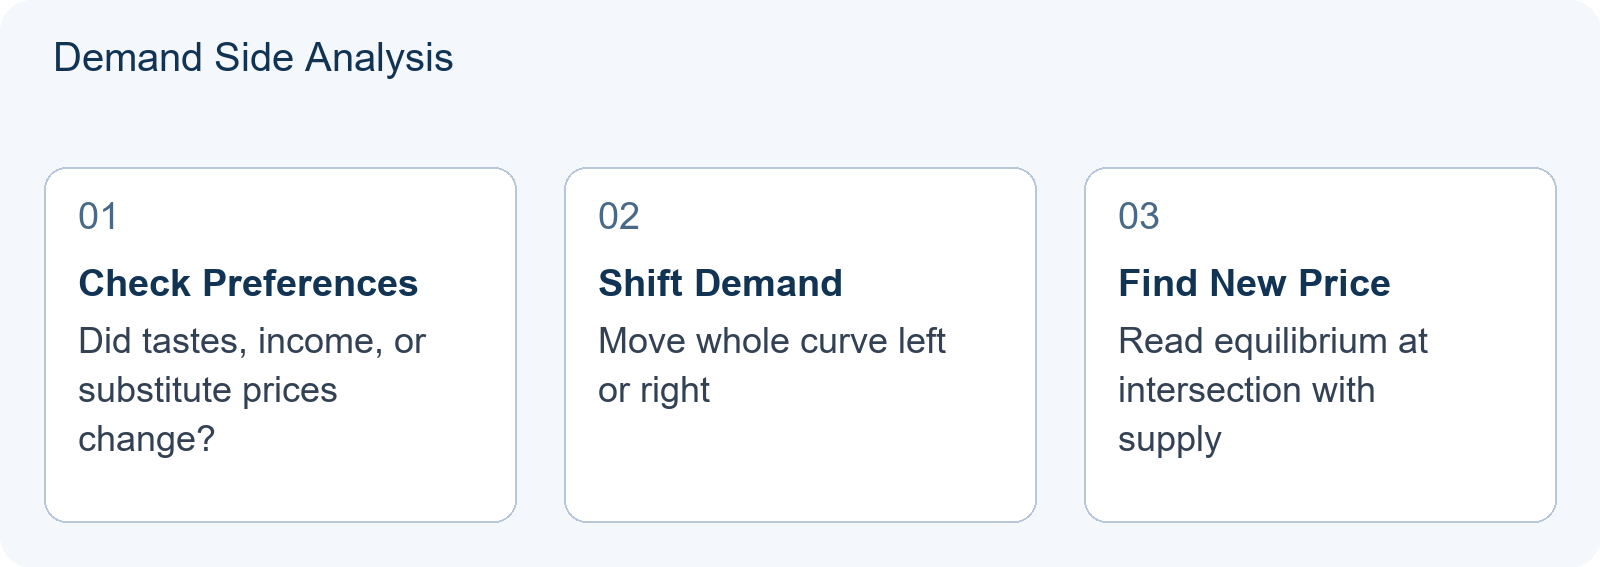
Frequently Asked Questions
Does a change in the price of a substitute cause a shift or movement?
It causes a shift in the demand curve for the original good. The price of the substitute is a non-price determinant from the original good’s perspective, altering relative attractiveness.
Can both curves shift simultaneously in IEO problems?
Yes, complex scenarios may involve simultaneous shifts. The analytical method is to hold one curve fixed, trace the effect of the first shift, then introduce the second shift and compare the net effect on equilibrium price and quantity.
How do I know if my graph labels are correct?
Verify that ‘demand’ labels the entire curve while ‘quantity demanded’ labels a single point. A shift changes the schedule at every price; a movement changes only the quantity at the current price. For IEO division context, note that the competition uses SENIOR, JUNIOR-HL, and JUNIOR-SL divisions, though specific division labels may vary by season.