Beyond time value and compounding, four of the finance blocks most worth drilling for the IEO are these: pricing a bond from its cash flows, splitting a credit spread into expected loss and premium, applying CAPM and two-asset diversification, and working out what fees do to a fund's net returns. Each reduces to one or two relationships. Below, each is worked through with real arithmetic and the trap that costs marks.
Why this layer? The IEO's individual component is a combined Economics and Finance test of 40 multiple-choice questions plus five open questions, of which four are graded; if the structure is new to you, start with what the IEO is and how its parts fit together. The organiser does not publish a weighted list of finance topics, so the priorities here come from our own coaches' analysis of the 2024 to 2026 rounds rather than from an official syllabus; confirm the published scope for your cycle on ieo-official.org. Two findings from that analysis explain this article. Modern finance, meaning CAPM, portfolio theory, bond valuation and credit spreads, was the growth area that deepened most, and it appeared as computation rather than vocabulary. And by our coaches' reading of the 2026 round, one open question ran on fund management under decreasing returns to scale, in an equilibrium where investors earn zero net alpha.
In a season plan this layer belongs after the foundations of time value and statement reading, in the middle weeks of our twelve-week preparation plan, and is worth revisiting before any mock paper.
Block 1: bond prices move against yields, and not symmetrically
A plain bond is a promise of fixed cash flows: a coupon each year and the face value at maturity. Its price is the present value of those cash flows, discounted at the market yield.
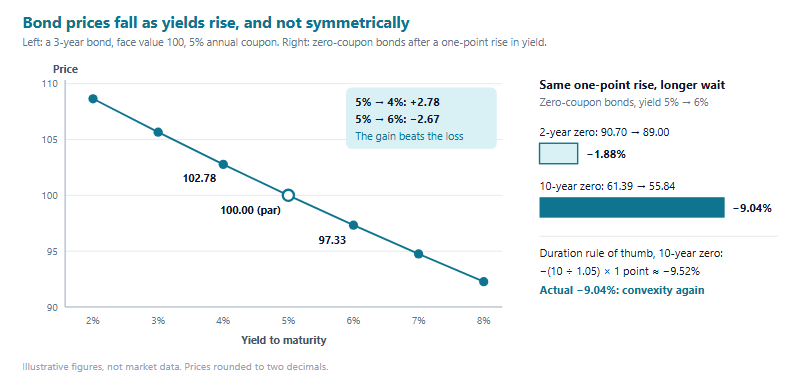
Take a three-year bond with a face value of 100 and a 5% annual coupon, so it pays 5, 5 and then 105. When the market yield is 5%, the price is exactly 100; a bond priced at par yields its coupon rate. Now move the yield one point each way.
- Yield 6%: 5 ÷ 1.06 + 5 ÷ 1.06² + 105 ÷ 1.06³ = 4.717 + 4.450 + 88.160 = 97.33
- Yield 4%: 5 ÷ 1.04 + 5 ÷ 1.04² + 105 ÷ 1.04³ = 4.808 + 4.623 + 93.345 = 102.78
A one-point rise in yield costs 2.67; a one-point fall gains 2.78. The gain is larger than the loss, and that asymmetry is convexity. Multiple-choice distractors are built around exactly this: an option treating the two moves as equal and opposite.
Maturity changes the size of the effect. A two-year zero-coupon bond with a face value of 100 is worth 90.70 at a 5% yield and 89.00 at 6%, a fall of 1.88%. A ten-year zero is worth 61.39 at 5% and 55.84 at 6%, a fall of 9.04%. The longer you wait for the cash, the more a change in the discount rate bites. The duration rule of thumb predicts the ten-year move as roughly −(10 ÷ 1.05) × 1 point, or −9.52%; the actual fall is smaller, and the gap is convexity again.
Three traps recur. For a plain bond the coupon rate is fixed by its terms and is not the yield. Current yield, the coupon divided by the price, is not yield to maturity. And a semi-annual coupon needs a semi-annual rate and twice as many periods; mixing an annual rate with half-year cash flows is the most common way to reach a wrong price through correct-looking steps.
Block 2: a credit spread is not just expected default
A credit spread is the extra yield a risky borrower pays over a government bond of the same maturity. The tempting mistake is to read all of it as the market's forecast of default. Work one through and you can see why that overstates the risk.
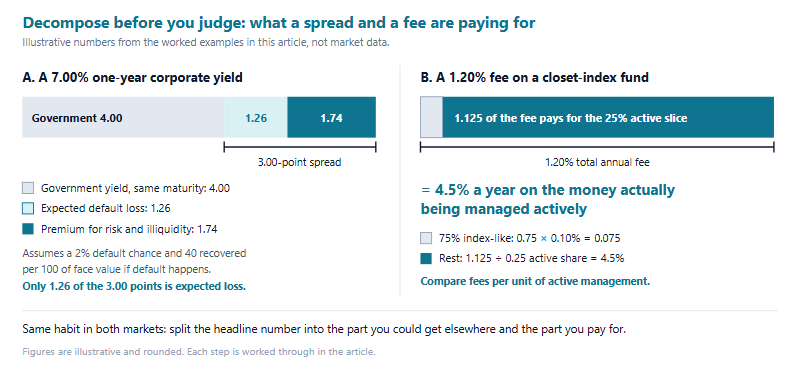
Suppose a one-year government bond yields 4% and a one-year corporate zero-coupon bond yields 7%, a spread of 3.00 points. Assume the company has a 2% chance of default, and that if it defaults you recover 40 of every 100 of face value.
- Expected payoff: 0.98 × 100 + 0.02 × 40 = 98.8
- Price if investors cared only about that average: 98.8 ÷ 1.04 = 95.00
- Yield at that price: 100 ÷ 95 − 1 = 5.26%, a spread of 1.26 points
So only about 1.26 of the 3.00 points compensates for expected default loss. The quick approximation, default probability times loss given default, gives 2% × 60% = 1.2 points and lands close. The remaining 1.74 points is a premium for bearing default risk that cannot be diversified away and for holding a less liquid bond.
That split explains how spreads behave. In a downturn expected defaults rise, and so does the premium investors demand for bearing the risk, so spreads widen, sometimes while government yields fall as money moves to safety. It also links finance to information economics: a lender that cannot tell safer borrowers from riskier ones prices the average, which is why better credit information can lower what a careful borrower pays.
Block 3: CAPM pays for market risk, not total risk
The capital asset pricing model says the return investors require from an asset is the risk-free rate plus the asset's beta times the market risk premium: required return = risk-free rate + beta × (market return − risk-free rate). Beta measures how strongly the asset moves with the market as a whole.
With a risk-free rate of 3% and an expected market return of 8%, the market risk premium is 5 points. A stock with a beta of 1.5 requires 3 + 1.5 × 5 = 10.5%. A stock with a beta of 0.5 requires 5.5%. So a volatile stock whose swings have little to do with the market can require less return than a calmer stock that moves closely with it: the unrelated part of its risk can be diversified away, and diversifiable risk is not rewarded.
Diversification is easy to state and easy to miscompute. Put half your money in asset A, with 20% volatility, and half in asset B, with 30%. Portfolio variance is 0.25 × 0.04 + 0.25 × 0.09 + 2 × 0.5 × 0.5 × ρ × 0.20 × 0.30, which simplifies to 0.0325 + 0.03ρ, where ρ is the correlation between the two.
- ρ = 1: variance 0.0625, volatility 25.0%. That is simply the weighted average; there is no benefit.
- ρ = 0: variance 0.0325, volatility 18.0%.
- ρ = −0.5: variance 0.0175, volatility 13.2%.
Alpha falls out of the same model. A fund with a beta of 1.2 that returns 10% when the risk-free rate is 3% and the market returns 8% needed 3 + 1.2 × 5 = 9%, so its alpha is one point before fees. The traps: putting total volatility where beta belongs, forgetting to subtract the risk-free rate from the market return, and treating CAPM's number as a forecast when it is a required return.
Block 4: fund fees, closet indexing and why net alpha drifts toward zero
Fees look small because they are quoted per year, so compound them. Invest 100 for 20 years at a 6% gross return. With a 0.10% fee you grow at 5.9% and end with 314.72. With a 1.00% fee you grow at 5.0% and end with 265.33, about 16% less, from a difference that looked like less than one percentage point.
Closet indexing sharpens the problem. Suppose a fund charges 1.20% a year, but only 25% of its portfolio differs from its benchmark index and the other 75% simply mirrors it. You could hold that 75% through an index fund charging 0.10%, which would cost 0.075 points. The remaining 1.125 points of fee therefore pays for the 25% active slice alone: 1.125 ÷ 0.25 = 4.5% a year on the money actually managed actively. Those active bets must beat the index by 4.5% a year just to match the cheap alternative.
The deeper idea is an equilibrium argument from Jonathan Berk and Richard Green's 2004 paper in the Journal of Political Economy. Suppose some managers really are skilled, but their ability to beat the market shrinks as their fund grows. Investors learn about skill from past returns, so money flows to funds that have done well, and each fund grows until the return investors can expect after fees is no better than the benchmark. Skill shows up in the size of the fund and in fee revenue, not in investors' net returns.
A stylised version makes it computable. Let gross alpha per dollar be 6% − 0.5% × q, where q is fund size in billions of dollars, and let the fee be 1%. Money keeps arriving until gross alpha minus the fee is zero: 6 − 0.5q = 1, so q = 10. The fund reaches $10 billion, the manager earns 1% of it, or $100 million a year, and investors earn zero net alpha. Raise the fee to 2% and the fund settles at $8 billion, yet fee revenue rises to $160 million. That is a comparative static of exactly the kind an open question can ask you to derive and then interpret.
The trap here is reading past outperformance as a forecast of future net returns. In this model, the outperformance is what attracts the money that competes the edge away.
Making the four blocks automatic
Each block rewards the same habit on both parts of the individual paper. On multiple choice, answer options are often built from specific errors: a symmetric price change, a whole spread read as default, total volatility in place of beta. Knowing the trap is how you recognise the distractor. On open questions the working is visible, so write the relationship, substitute the numbers with units, and finish with one sentence on what the number means for the investor or the policy in question.
| Block | Core relationship | Worked result in this article | The trap that costs marks |
|---|---|---|---|
| Bond pricing | Price = each coupon and the face value, discounted at the yield | 3-year 5% bond: 102.78 at 4%, 100.00 at 5%, 97.33 at 6% | Treating price moves as symmetric; mixing annual rates with half-year coupons |
| Credit spreads | Spread = risky yield − same-maturity government yield | 3.00-point spread = 1.26 expected loss + 1.74 premium | Reading the whole spread as the expected default rate |
| CAPM and diversification | Required return = risk-free rate + beta × (market return − risk-free rate) | Beta 1.5 requires 10.5%; a 50/50 mix at zero correlation has 18.0% volatility | Using total volatility where beta belongs |
| Fund fees and net alpha | Net alpha = gross alpha − fee; judge fees per unit of active share | 1.20% fee at 25% active share = 4.5% a year on the active slice | Reading past outperformance as a forecast of net returns |
- One block a week, fifteen minutes a day. First recompute this article's numbers from a blank page. Then change one input, predict the direction of the answer, and only then calculate.
- Keep a one-page relationship sheet you wrote yourself. Do not assume a formula sheet or calculator will be allowed in your round; confirm the policy for your round before relying on either.
- Carry it into the case. A funding decision in a business case is a natural home for discount rates, risk premia and the cost of capital. Our guide to the team business case shows where a numbers role fits in a team.
Common questions
Is CAPM on the official IEO syllabus?
The IEO sets the scope for each cycle. Our priorities come from coaches analysing the 2024 to 2026 rounds, so confirm scope on ieo-official.org.
Do I need calculus to price a bond?
No. Pricing means discounting fixed cash flows by powers of one plus the yield. Duration intuition helps, but the arithmetic is algebra.
Why does a bond price fall when yields rise?
Its cash flows are fixed, so a higher discount rate lowers their present value. The price falls until a new buyer earns the new yield.
How should I compare the fee of a closet-index fund?
Divide the fee above index cost by active share. A 1.20% fee with 25% active share costs about 4.5% a year on the active slice.
This is an independent guide operated by Hanlin Education for China-based international-school students. We are not affiliated with, endorsed by, or sponsored by the International Economics Olympiad Association. Topic priorities are our coaches' analysis rather than an official syllabus, and all figures are illustrative; confirm current scope, format and calculator policy on ieo-official.org. Errors are corrected within 7 working days of being reported.