When a business case asks whether growth improves the business, the real test is whether revenue scales faster than the costs that serve each additional customer. Many students reach for revenue growth rates first and stop there. The better path is to compare how each extra unit of activity changes contribution margin, fixed cost coverage, and ultimately cash flow. This article works through two original teaching illustrations to show the reasoning in action, then isolates the common mistake with a practical diagnostic.
Why Unit Economics Matter More Than Top-Line Growth
Growth can mask poor economics. A business may acquire customers quickly while losing money on each one, hoping to fix unit economics later. In case competitions, the task is to judge whether the current trajectory supports that hope or undermines it. The key is to separate variable costs that scale with output from fixed costs that do not, then see whether the margin per unit is rising, stable, or falling as volume expands.
The The Business Toolkit for the IEO Case Round: Unit Economics, Break-Even and Sizing a Market covers break-even and market sizing in broader detail. This article narrows in on the specific reasoning failure: assuming growth is good without testing the per-unit story.
Teaching Illustration A: Growth That Improves the Business
Imagine a subscription software company with the following simplified structure at two volume levels.
| Metric | At 10,000 users | At 50,000 users |
|---|---|---|
| Price per user/month | $20 | $18 (volume discount) |
| Variable cost per user | $8 | $6 (server economies) |
| Contribution margin/user | $12 | $12 |
| Monthly fixed costs | $80,000 | $120,000 (expanded support) |
| Total contribution | $120,000 | $600,000 |
| Operating profit | $40,000 | $480,000 |
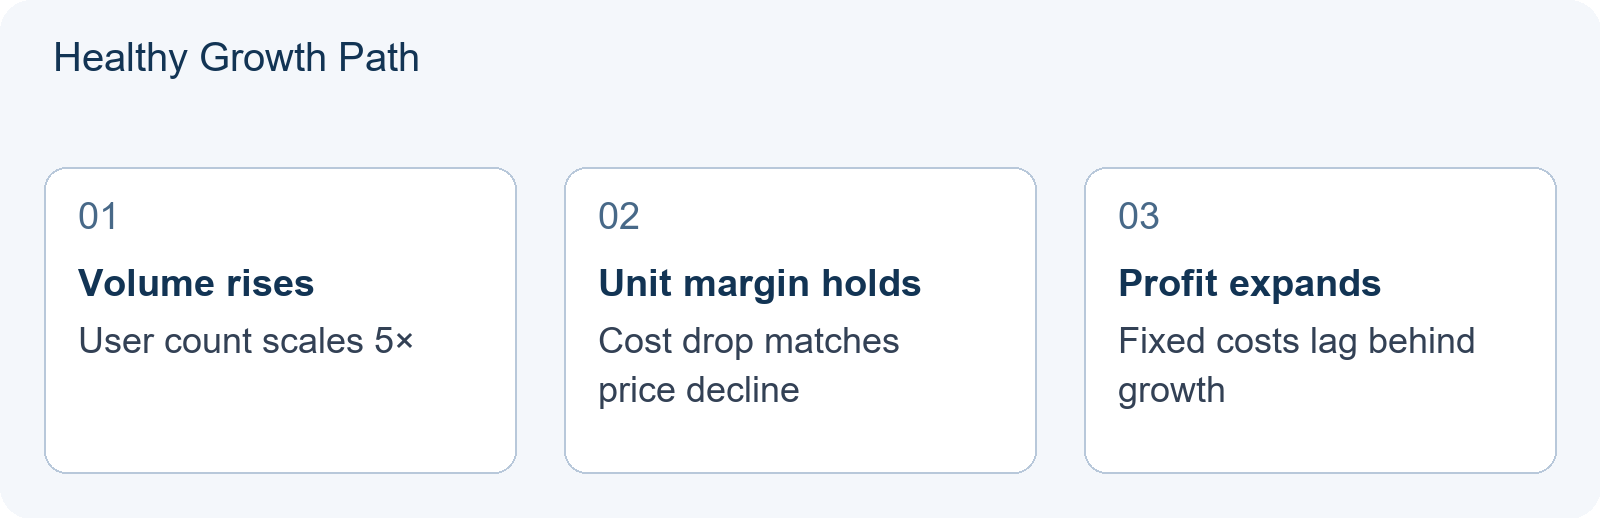
Here growth improves the business. Contribution margin per user holds steady at $12 despite lower prices, because variable costs fall faster. Fixed costs rise, but not proportionally to volume. Operating profit expands from $40,000 to $480,000. The business has operating leverage: each new user adds $12 toward a fixed-cost base that grows more slowly than user count.
A student analyzing this case should note three signals: (1) contribution margin per unit is stable or rising, (2) fixed cost per unit is falling, and (3) the break-even user count is lower at the larger scale than a naive linear projection would suggest.
Teaching Illustration B: Growth That Masks Weak Economics
Now consider a direct-to-consumer meal kit company at two volume levels.
| Metric | At 5,000 boxes/week | At 20,000 boxes/week |
|---|---|---|
| Price per box | $45 | $40 (promotional pricing) |
| Variable cost per box | $28 | $32 (ingredient premiums) |
| Contribution margin/box | $17 | $8 |
| Weekly fixed costs | $50,000 | $80,000 (regional warehouse) |
| Total contribution | $85,000 | $160,000 |
| Operating profit | $35,000 | $80,000 |
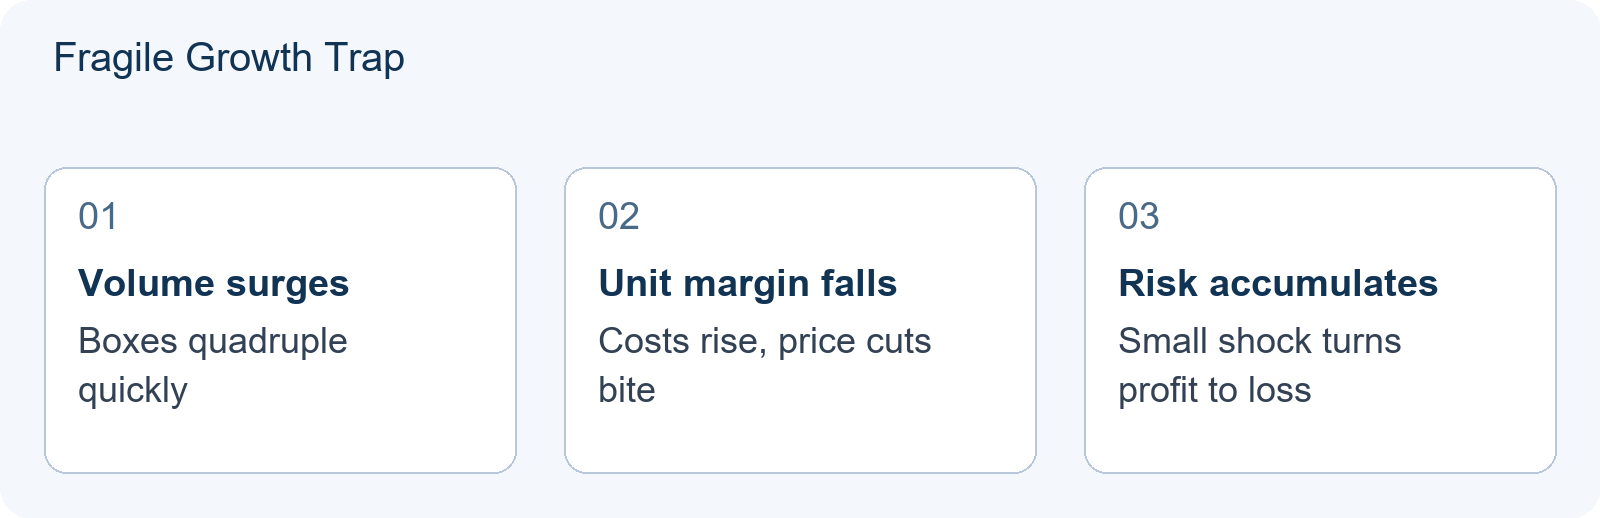
Revenue quadruples. Operating profit more than doubles. Yet the business is worse off in ways the headline numbers hide. Contribution margin per box collapses from 8 because promotional pricing and supply constraints raised variable costs. Break-even rises from 2,941 boxes (17) to 10,000 boxes (8), meaning the larger operation needs more than three times the volume to cover each dollar of fixed cost despite only 4× scale.
This is the trap: total profit grew, but unit economics deteriorated. The business is more fragile at larger scale, not less. If ingredient premiums rose another 36 per box, the margin would fall to $4, and the 20,000-box operation would need 20,000 boxes just to break even ($4 × 20,000 = $80,000). The scaled operation now requires twice as many boxes to cover each dollar of fixed cost increase compared to the original 5,000-box baseline, where each dollar of fixed cost was supported by $17 of contribution.
Diagnostic: Spotting the Mistake Before You Commit
The error in Teaching Illustration B is treating total profit growth as proof of healthy expansion. The diagnostic below helps catch this in practice.
| Question to ask | Healthy growth (Illustration A) | Fragile growth (Illustration B) |
|---|---|---|
| Is contribution margin per unit rising or stable? | Yes, $12 maintained | No, fell from 8 |
| Are variable costs per unit falling with scale? | Yes, 6 | No, rose 32 |
| Does fixed cost growth lag volume growth? | Yes, 5× users, 1.5× fixed | No, 4× volume, 1.6× fixed |
| Would a small price or cost shock break profitability? | No, wide margin buffer | Yes, narrow margin at risk |
Apply this table as a quick sanity check when a case presents growth data without clear unit-level breakdowns. If two or more answers point to fragility, the recommended action is to model a downside scenario before endorsing expansion.
A Targeted Practice Sequence
To build fluency with this reasoning, work through the following steps with any practice case you encounter:
- Isolate the unit of analysis: per customer, per transaction, or per subscription period.
- Reconstruct contribution margin at two or more volume levels using the case data.
- Identify which cost lines are truly variable versus stepped or fixed.
- Test whether the case’s growth assumptions hold if variable costs rise 10–15 percent.
- State a conditional recommendation: expand if unit margins hold, pause or restructure if they compress.
For additional grounding in case structure, see What the IEO Business Case Has Actually Asked: Three Prompts, One Recurring Shape. For students building economics foundations from other disciplines, IEO Preparation for STEM Students: Starting Without School Economics offers a relevant starting point.
What to Demonstrate Next
After working through these teaching illustrations, a learner should be able to: calculate and compare contribution margin per unit across scenarios; distinguish operating leverage from revenue growth alone; and recommend expansion, pricing changes, or cost restructuring based on unit-level evidence rather than aggregate profit trends. This analytical skill directly supports preparation for the business case component of economics olympiad competitions, where reasoning that connects scale decisions to underlying economics is typically rewarded.
Frequently Asked Questions
Should I always calculate contribution margin per unit in a business case?
When the case provides cost and price data at multiple volumes, yes. It is the fastest way to test whether growth is improving or eroding the business. If data is missing, state the assumption you need and explain how it would change your conclusion.
How do I handle stepped costs that change at certain volume thresholds?
Treat each volume band as a separate scenario. Calculate unit economics within each band, then compare whether the jump in fixed cost is justified by the incremental contribution it enables.
Can I use this framework for non-subscription businesses?
Yes. Define the unit as whatever scales most naturally: per transaction for retail, per passenger for airlines, or per gigawatt for utilities. The logic of comparing incremental revenue to incremental cost remains the same.